View MaxFrame jobs with Logview#
Logview is a tool that records and displays the execution status of MaxCompute jobs. It has been adapted for MaxFrame. This page describes how to use Logview to inspect MaxFrame job execution information.
Overview#
Logview has been adapted for MaxFrame and supports the following capabilities:
View execution records and elapsed time of all DAGs submitted from a MaxFrame session.
Interactively view the execution order, runtime, operator topology, and status relations of every Sub DAG inside a DAG.
View the configuration, runtime status, memory and CPU resource usage of each sub-instance.
For general information about Logview, refer to Use Logview 2.0 to view job information. This page focuses on viewing MaxFrame job information.
MaxFrame Logview entrance#
After you create a session with session = new_session(...), the
system automatically generates a URL that starts with
https://logview.aliyun.com/logview.
When you submit MaxFrame jobs from DataWorks, click the URL directly to open the MaxFrame Logview UI.
When you submit MaxFrame jobs from a local environment, call
session.get_logview_address()to print the URL, then copy it into your browser.
The MaxFrame Logview UI looks as follows:
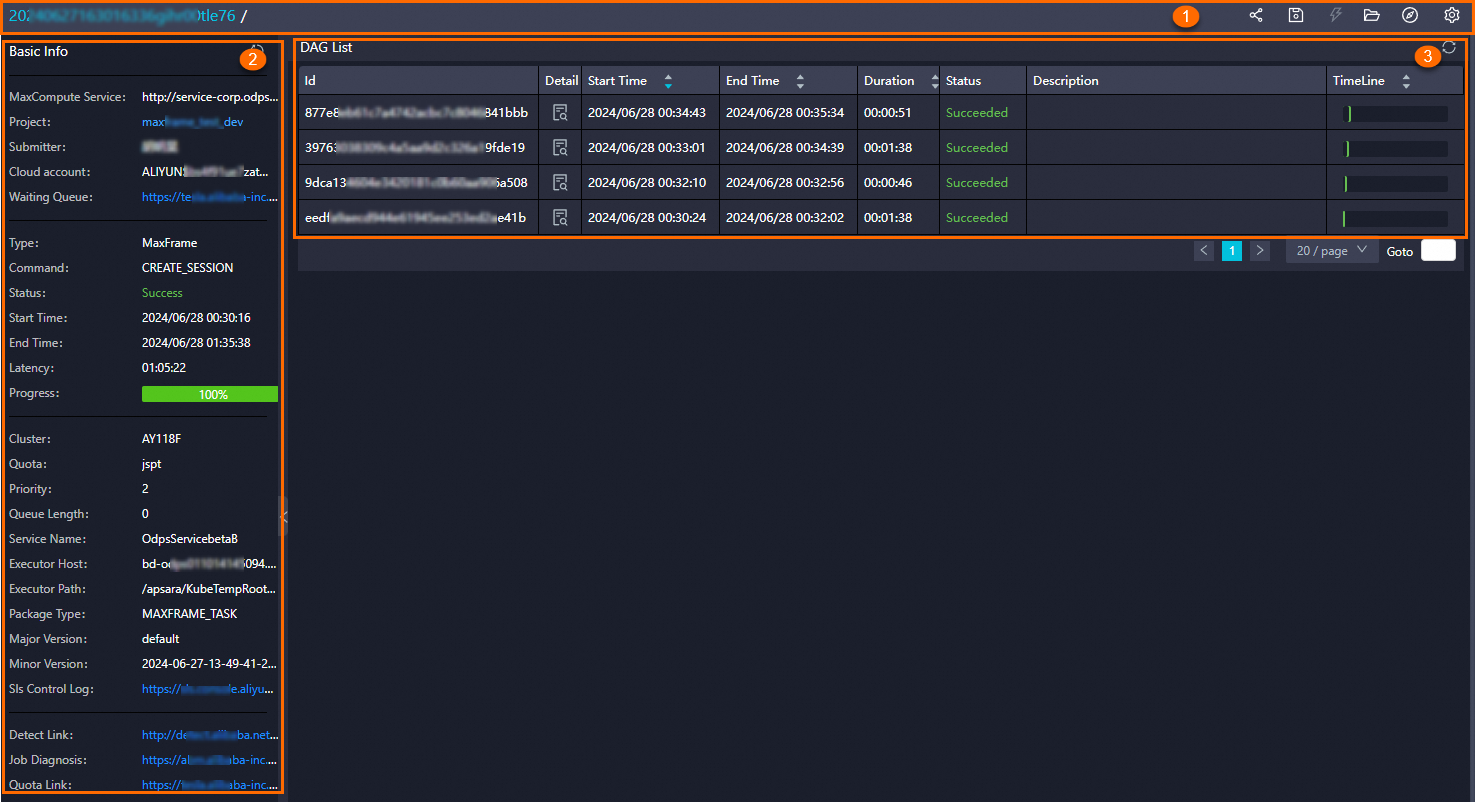
Number |
Area |
|---|---|
① |
Title and feature area. See Title and feature area. |
② |
Basic Info. See Basic Info. |
③ |
DAG list. See DAG list. |
Title and feature area#
The title and feature area shows the unique job ID generated when you submit the job, plus the custom job name. The following operations are also available.
Icon |
Function |
|---|---|

|
Get the MaxFrame Logview URL. |

|
Save the job details file to the local device. |

|
Stop the current job process. |

|
Open the locally saved |
Job list icon |
Open the job list to view jobs under the specified project. |
Auto refresh toggle |
Enable or disable auto refresh. When enabled, the page refreshes every 10 seconds. |
DAG list#
The DAG list is sorted by the order in which execute() was called, in
descending order. The most recently submitted job appears first. The
columns are described below.
Column |
Description |
|---|---|
Id |
DAG ID. A unique identifier generated for every |
Detail |
Click the icon to view the corresponding Sub DAG details. |
Start Time |
Time when the DAG was submitted. |
End Time |
Time when the DAG completed. Empty if the DAG is still running. |
Duration |
DAG runtime, calculated from Start Time to End Time (or to the current time if still running). |
Status |
Job status. See Status values below. |
Description |
Description of the DAG. |
Status values
Preparing: The DAG is being parsed and has not started execution.
Running: The DAG is running.
Succeeded: The DAG finished successfully.
Failed: The DAG failed.
Cancelling: The DAG is being cancelled.
Cancelled: The DAG has been cancelled.
Sub DAG details#
The Sub DAG details page contains the following four areas:
Number |
Area |
|---|---|
① |
Sub DAG Graph. See Sub DAG Graph. |
② |
Sub DAG list. See Sub DAG list. |
③ |
Instance list of the Sub DAG. See Instance list. |
④ |
Basic Info of the Sub DAG. See Basic Info. |
Sub DAG Graph#
The Sub DAG Graph helps you quickly understand the current DAG.
Number |
Description |
|---|---|
① |
Current Sub DAG ID. Click it to return to the DAG list page. |
② |
Breadcrumb navigation. Use it to switch between Sub DAG levels. |
③ |
Diagnostic helpers, including Progress Chart, Input Heat Chart, Output Heat Chart, TaskTime Heat Chart and InstanceTime Heat Chart. |
④ |
Refresh job execution status, switch to full screen or zoom the execution graph, open MaxCompute Studio docs, and switch to the parent task level. |
⑤ |
Zoom helpers. |
⑥ |
Table node. Represents an ODPS table. |
⑦ |
Sub DAG node. See Sub DAG node fields below. |
⑧ |
Data flow. Represents data movement between STAGEs or between a STAGE and a table. |
⑨ |
Canvas overview pane. |
Sub DAG node fields
STAGE_X: Sub DAG name. The number indicates execution order, starting from 1 and increasing.X/X/X(for example0/5/5): Number of ODPS instances in different states inside the current Sub DAG, in the order running / completed / total.Start and end time.
MCSQL: Engine that executes the current Sub DAG.OP 1: Number of operators contained in the current Sub DAG. Double-click the node to view the operator graph.
Sub DAG list#
This list shows the runtime information of all Sub DAGs in the current DAG, sorted by time.
Column |
Description |
|---|---|
Sub DAG |
Name of the current Sub DAG. |
Failed/Terminated/ALL |
Number of ODPS instances in different states inside the current Sub DAG. |
Status |
Sub DAG status: Failed / Cancelled / Running / Succeeded. |
Progress |
Sub DAG progress. Reaching 100% in the Running state only means all instances scheduled so far have finished, not that the Sub DAG itself is complete. |
Start Time |
Sub DAG submission time. |
End Time |
Sub DAG completion time. |
Duration |
Sub DAG runtime. |
Timeline |
Timeline preview that shows the start order and time consumption. |
Instance list#
This list shows the ODPS instance jobs related to the Sub DAG.
Column |
Description |
|---|---|
Instance ID |
ID of the ODPS instance job. |
Status |
Instance status. See Instance status values below. |
Detail |
Job details. |
Start Time |
Job submission time. |
End Time |
Job completion time. |
Duration |
Job runtime. |
Timeline |
Timeline preview that shows the start order and time consumption. |
Instance status values
Failed: Execution failed.
Cancelled: The job was cancelled.
Running: The job is running.
Terminated: The job finished successfully.
Fallback: The job was downgraded; a new instance record will be created.
Unknown_terminated: The job has finished, but it is not known whether it succeeded or failed.
Fuxi Sensor#
Fuxi Sensor is the full-dimension resource view of a MaxFrame job. You can use Fuxi Sensor to view the actual CPU and memory consumption of every Fuxi instance. It is an essential tool for diagnosing job issues and analyzing job runtime quality. For example, Fuxi Sensor helps with the following scenarios:
Determine the actual amount of memory used when a job runs out of memory.
Inspect the resource usage of MaxFrame Fuxi instances:
CPU usage
The CPU chart contains two lines: one shows the requested CPU (
cpu_plan), the other shows the actual CPU usage (cpu_usage). On the y-axis,400means 4 processors. The requested CPU can be adjusted only by changing the number of processors. The actual CPU usage cannot be tuned directly.Memory usage
The memory chart contains two lines: requested memory (
mem_plan) and actual memory usage (mem_usage).
Use cases#
View the longest-running stage#
The Timeline column in the DAG list, Sub DAG list, and Instance list lets you quickly find the longest-running DAG, Sub DAG, or Instance at the current level.
Note
When the list is long and paginated, sort the Duration column in descending order to find the longest-running entries quickly.
View the cause of an execution failure#
When a DAG fails or the client returns an exception, follow these steps in MaxFrame Logview:
Check the status of every DAG in the DAG list.
Find the most recent DAG with status
Failedand click the icon in the Detail column to view the details.On the DAG details page, find the Sub DAG node displayed in red (for example
STAGE_1). The Result page also shows the error message.Click the failed Sub DAG node
STAGE_1. In the Instance list, click the icon in the Detail column to find the failed instance.
View operators contained in a Sub DAG#
There are two ways to view the operators contained in a Sub DAG:
Method 1: On the DAG details page, click the Sub DAG node.
Method 2: On the DAG details page, double-click the Sub DAG node.
Note
Each operator is annotated with the line of MaxFrame script code it corresponds to.
Some operators are tagged with
merged from. This means the optimizer merged multiple operators after DAG submission to produce a new operator with the same functionality but better performance.
View table data#
View the data flow structure
To inspect the data flow, double-click a Sub DAG node on the DAG details page to enter the operator details page. Click the connection line between two operators to view the data type, index, and column name information.
The fields are described below:
Type: dataframe: The upstream operator outputs adataframe.DataFrame Index: Index information.None: int64means the DataFrame contains a single unnamed index of typeint64.DataFrame Columns: Column information.<column name>: <dtype>lists every column in the current DataFrame with its data type.DataFrame Level Names: The level names of the current DataFrame.
View the data table structure
Click any operator graph or any ODPS Table node in the Sub DAG Graph to view the table structure.
View job details#
On the DAG details page, click the icon in the Detail column of the Instance list to view the job details.